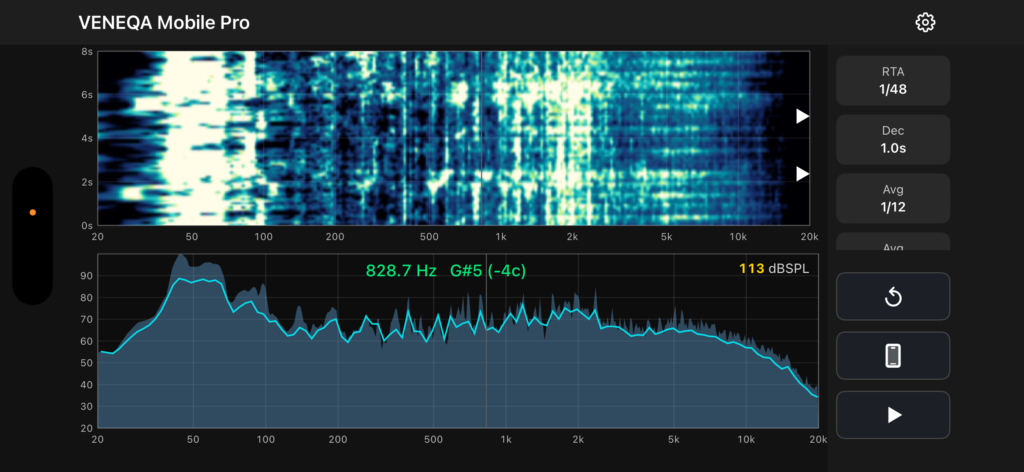
Everything You Need to Analyze Sound.
Powerful Features. Built for Every Workflow.
Simulation Mode
See the Room. Understand the Reflections.
Venue Presets
Save each venue’s dimensions and speaker positions to instantly visualize its reflection characteristics and room modes.
Starting with Version 2.0, venue data will also be available for download from the cloud-based VENUE Intelligence Library.
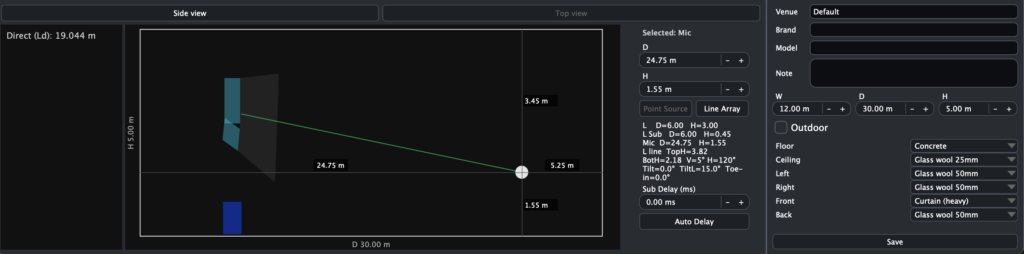
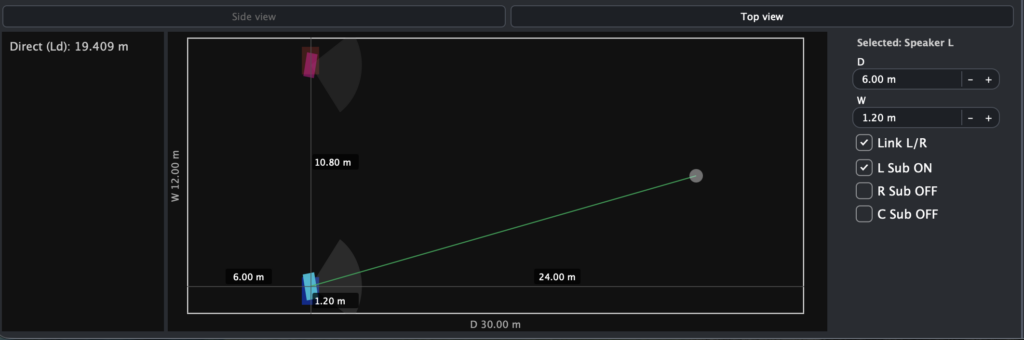
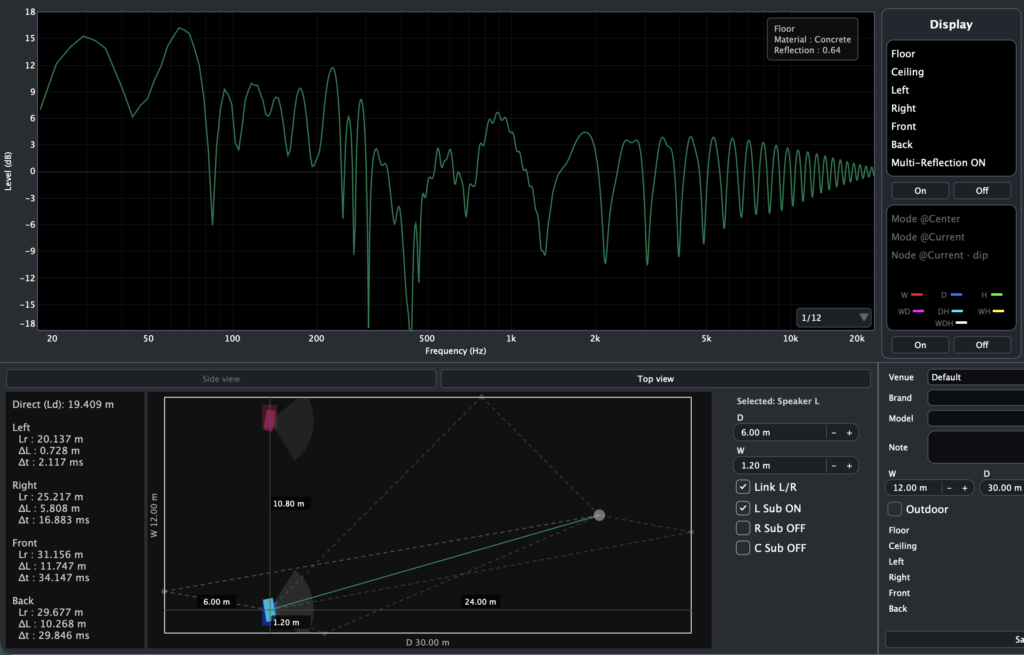
Reflection
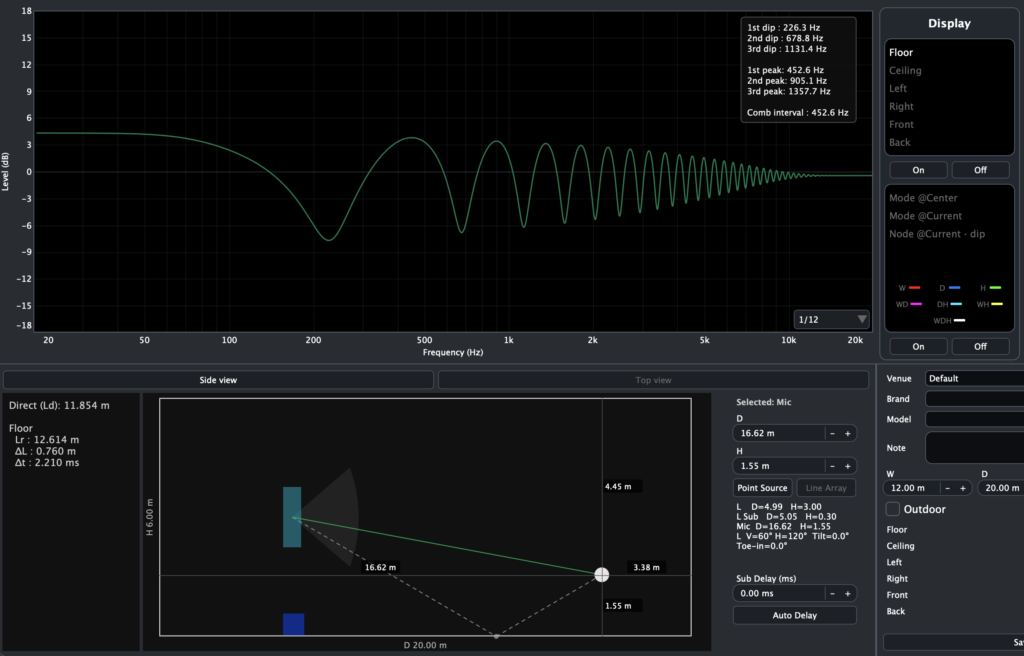
Visualize the reflection characteristics of a room and see how reflected sound affects the frequency response.
Understand where reflections come from and how they interact with the direct sound, helping you identify the causes of peaks and dips in your measurements.
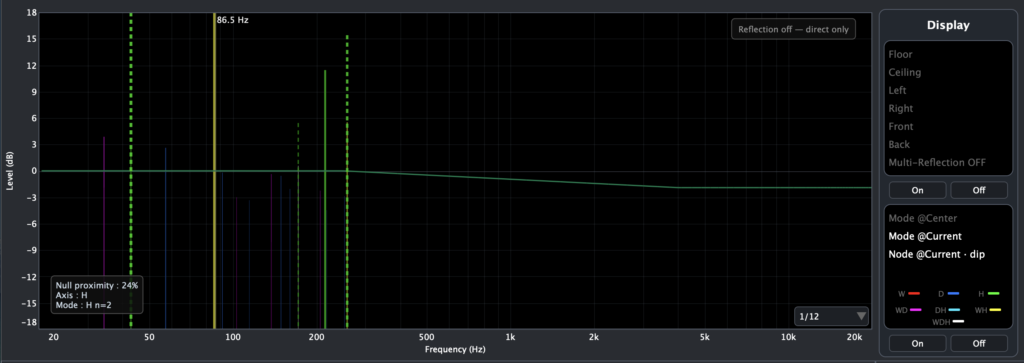
Room Mode
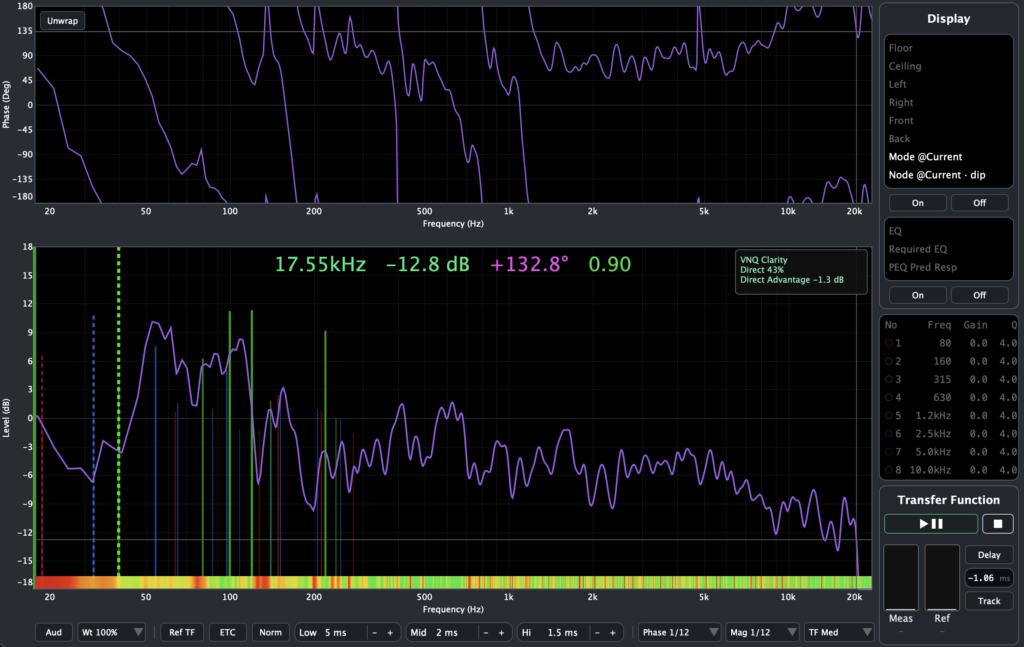
Visualize the strength of room modes at the measurement position.
Modes associated with the room’s width, height, and depth are color-coded, while line thickness and height indicate their relative strength. Hover over a mode to see its modal order.
Nodes represent the nodal points of standing waves, highlighting frequencies where cancellation may occur.
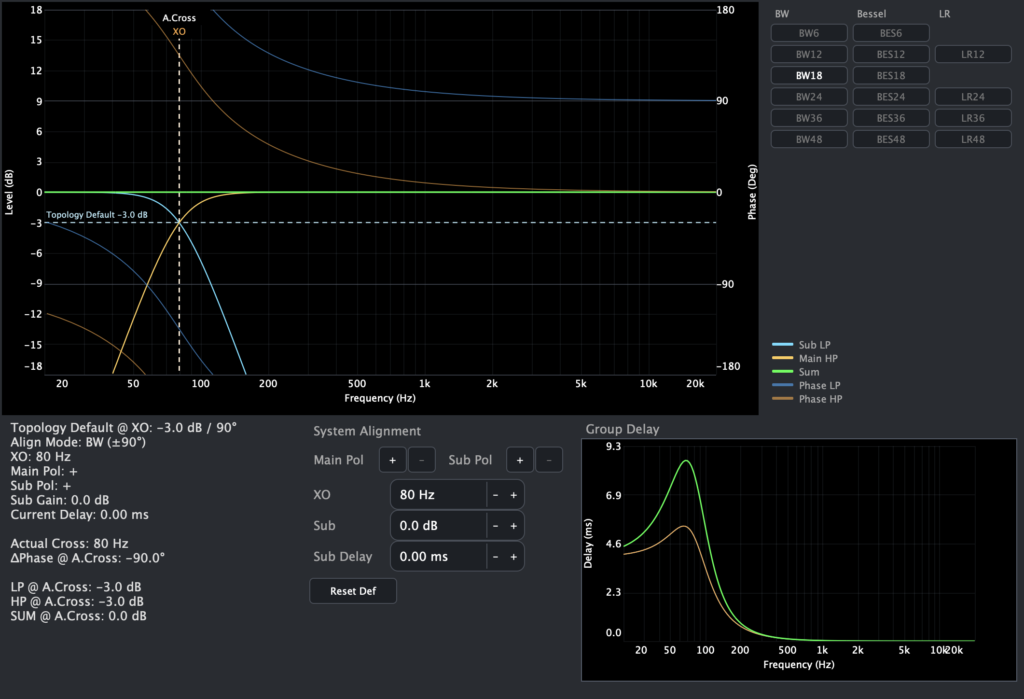
XO Filter Study
Detailed resources on crossover filters are surprisingly limited, leaving many engineers without a clear understanding of their characteristics.
VENEQA makes them easier to explore and understand by visualizing the magnitude and phase responses of Butterworth, Linkwitz-Riley, and Bessel filters.
Tuning Mode
Are you a single pointer or spatial averager? Either way, VENEQA has you covered.
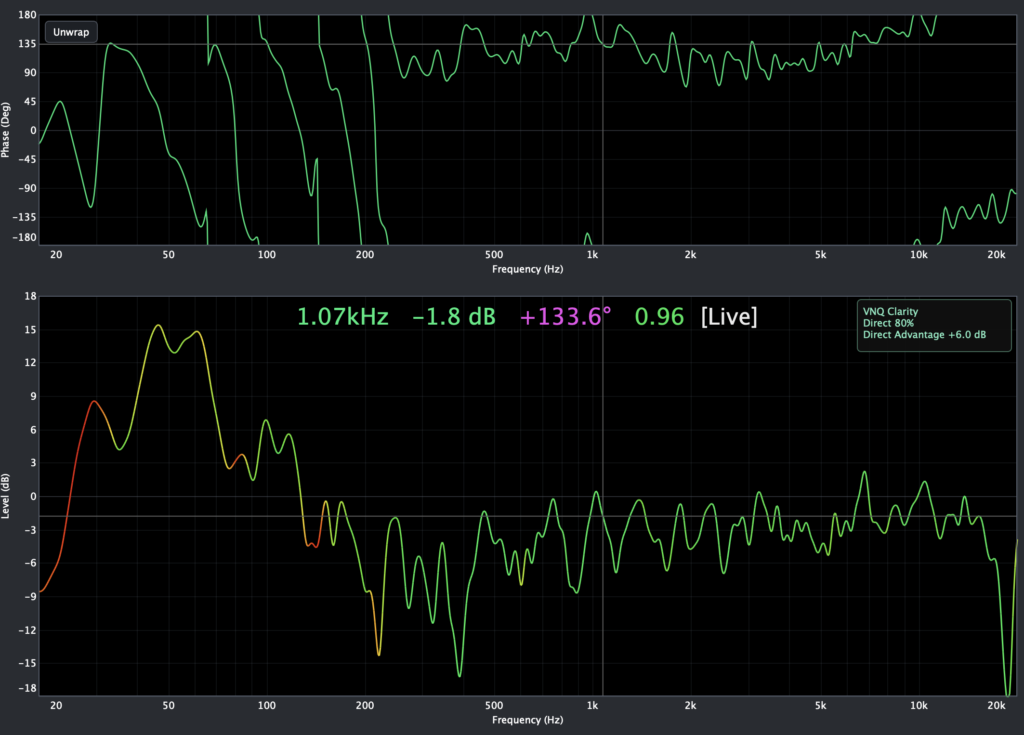
Transfer Function
Optimized for FOH engineers, VENEQA’s Transfer Function is packed with tools designed to help you make faster decisions and tune with confidence.
Reflection Overlay
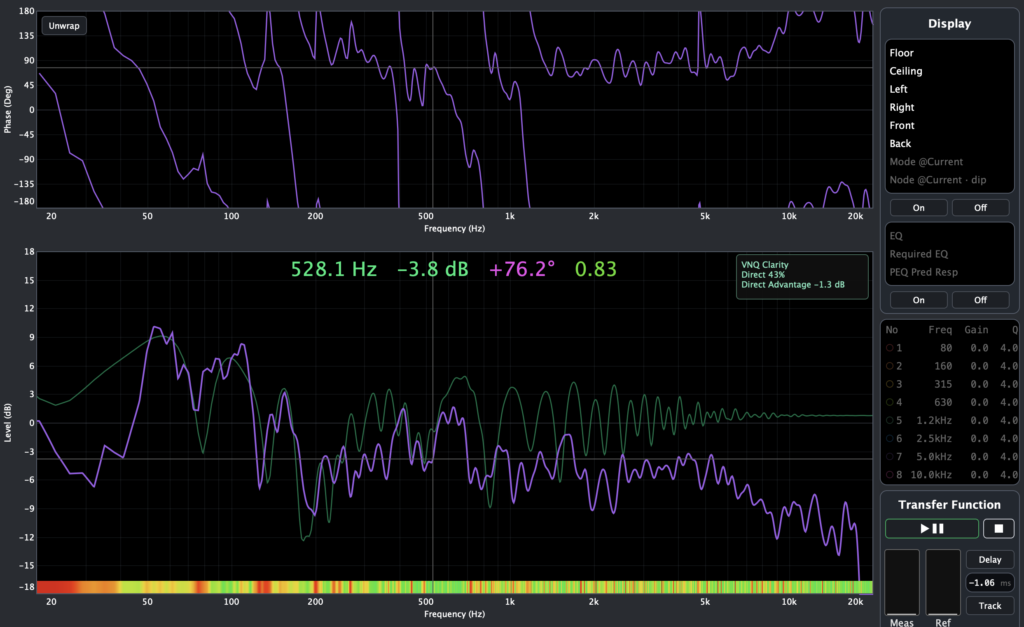
Overlay the reflection characteristics and room modes of a venue configured in Simulation Mode directly onto the Transfer Function.
This may help you identify which surface is responsible for a dip, or determine whether it is influenced by room modes.
Refl TF
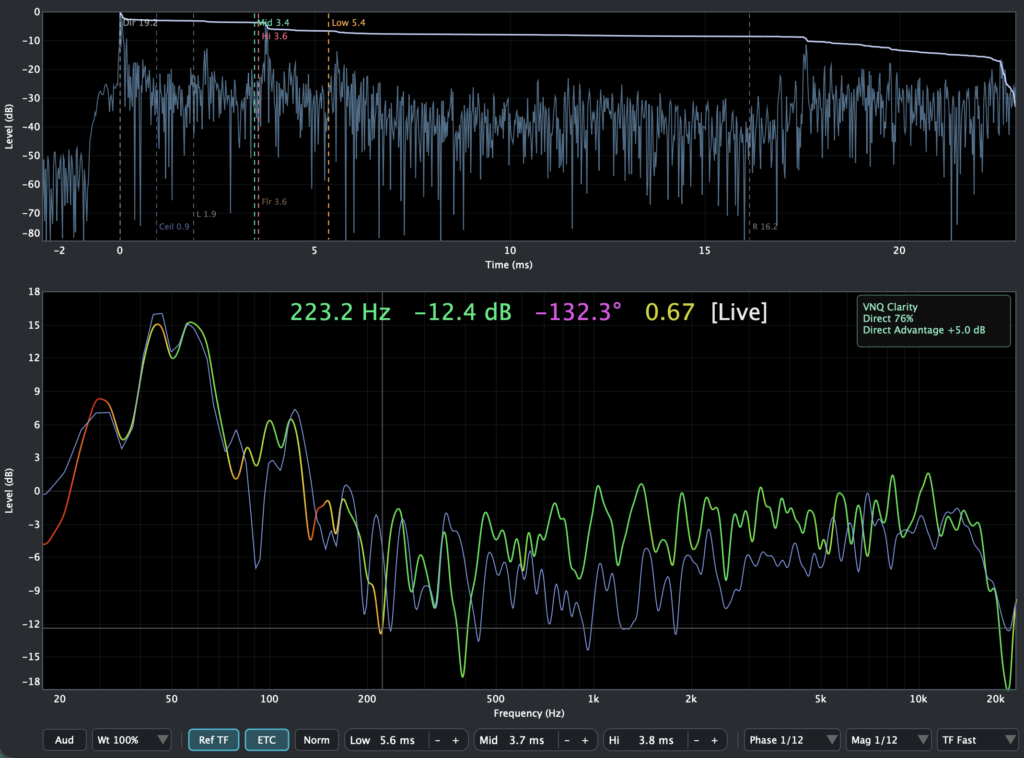
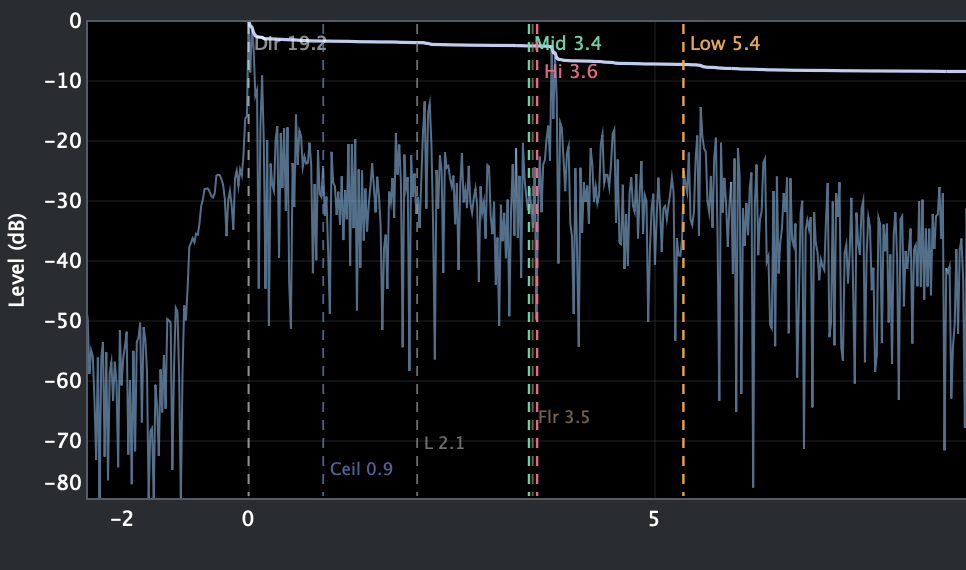
Separate direct sound and reflections using the impulse response, then visualize the reflected sound as a Transfer Function.
By comparing the Total TF with the Refl TF, you may be able to determine whether a dip is caused by interference from reflections or by phase interference resulting from differences in arrival time between multiple sources.
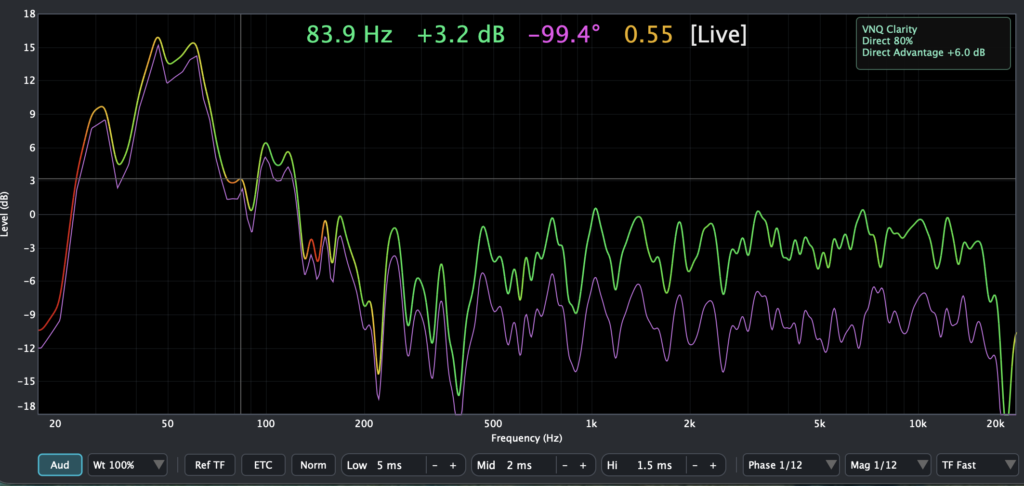
Audience Attenuation
Visualize a predicted response for when the audience is present.
The audience attenuation curve is estimated based on the Total TF, the amount of reflected sound, and the floor material, allowing you to see how the frequency response may change when the venue is filled.
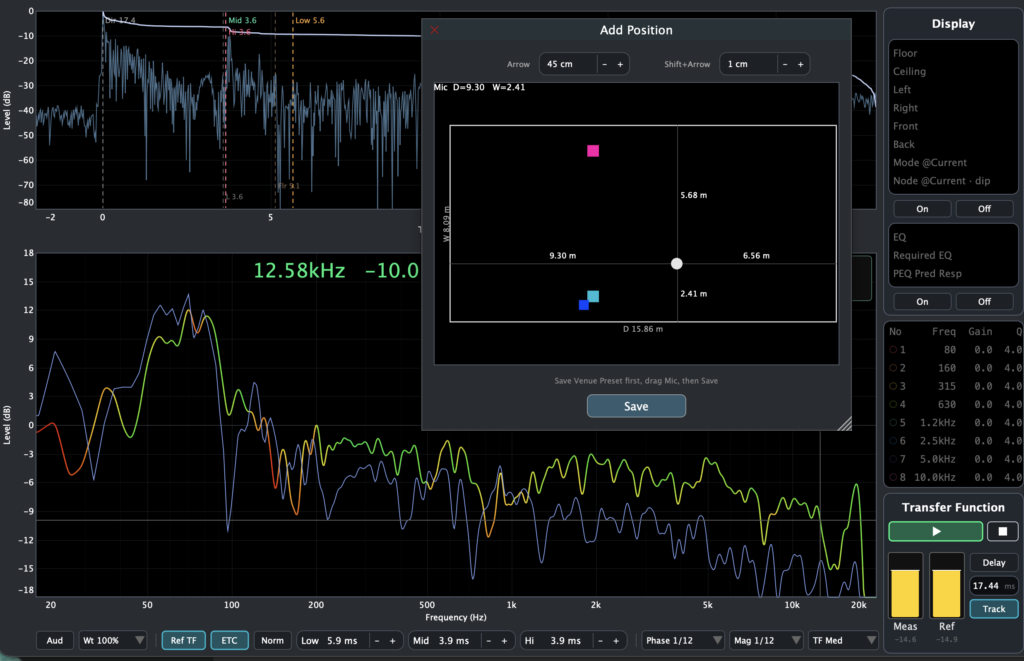
Add Position
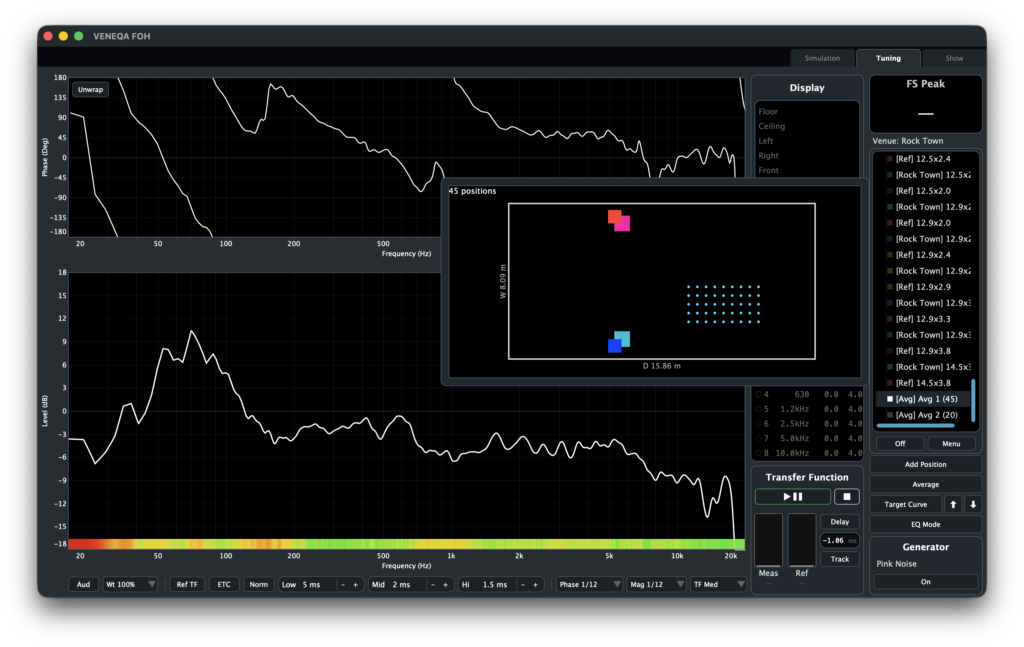
Add position coordinates to your captured traces.
Position data is also used by the Reflection Overlay feature, making it easier to review and analyze your measurements later.
When averaging multiple measurements, you can also see at a glance which positions were included in the average.
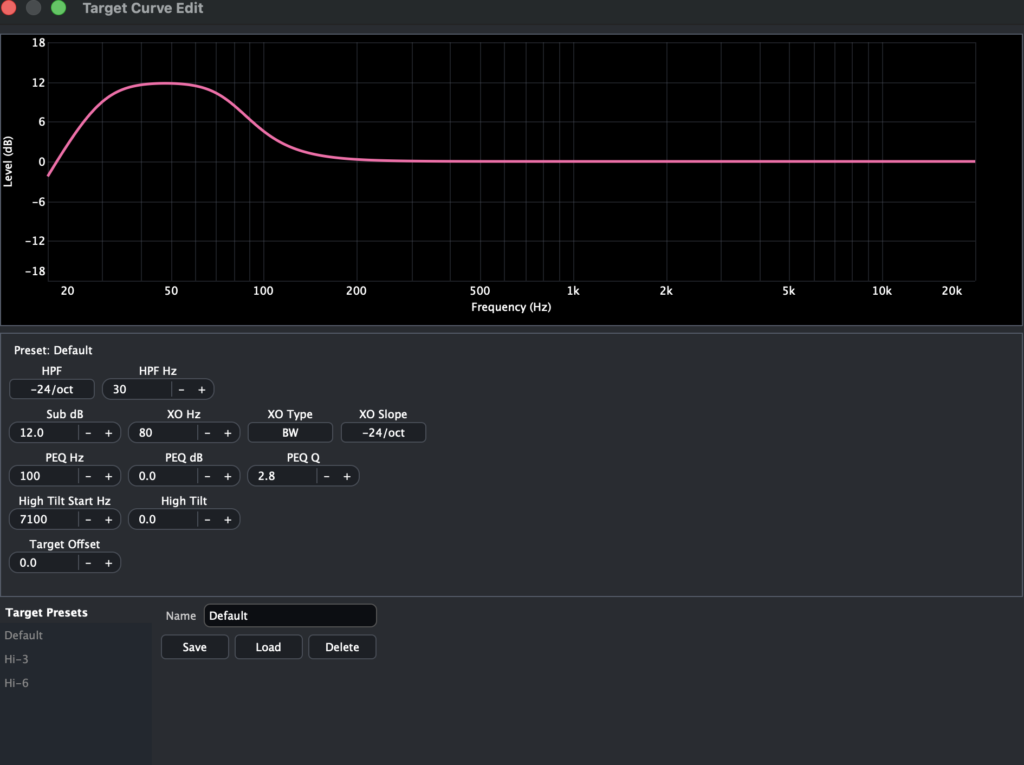
Target Curve Editor
Easily edit, save, and load target curves to suit your preferences.
Auto PEQ
Automatically generate a PEQ curve based on your selected averaged trace.
Simply enter the displayed PEQ parameters into your mixer to complete your tuning.
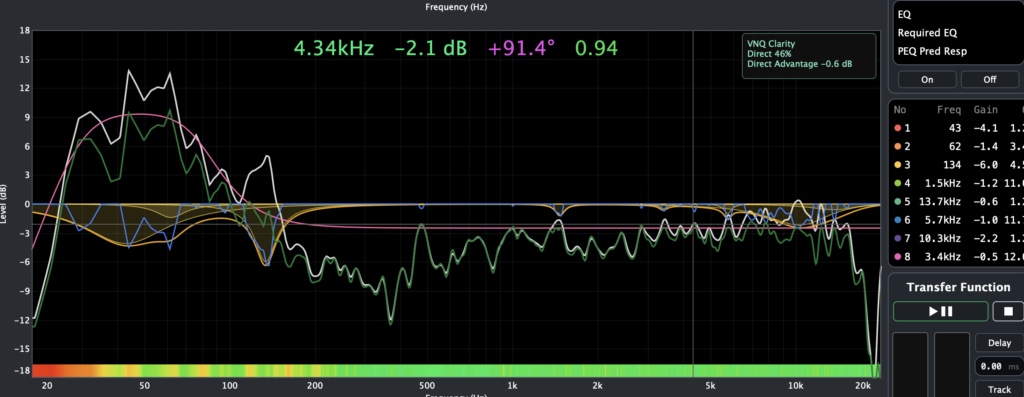
EQ Mode
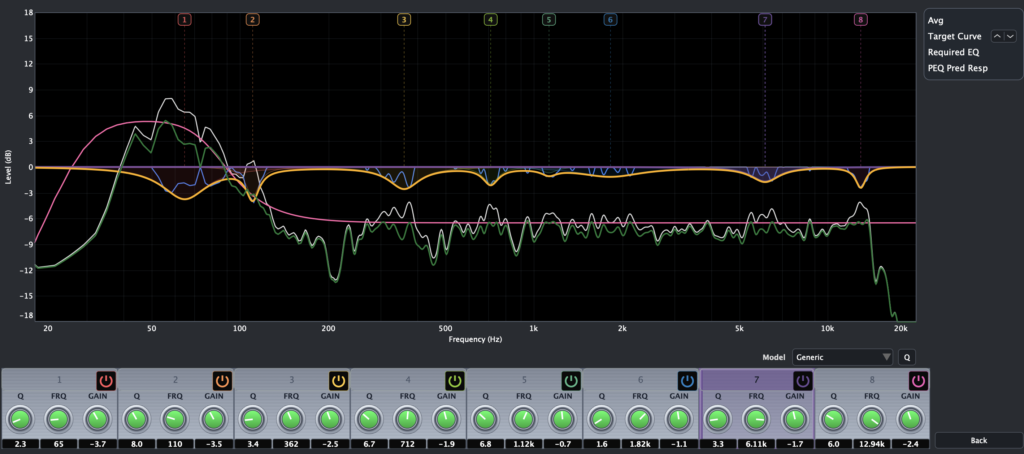
Edit your generated PEQ curve with ease.
Select your mixer model to view the EQ curve using the actual characteristics of its PEQ filters. The predicted response after EQ is displayed in real time, allowing you to create accurate EQ curves without measuring each EQ adjustment.
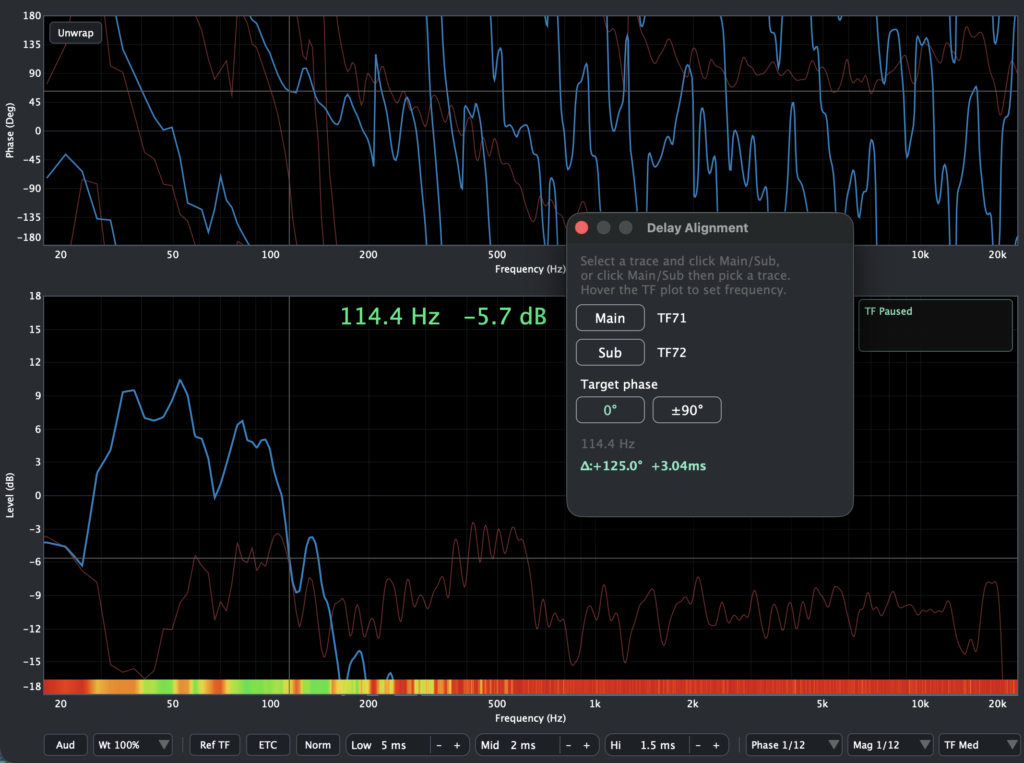
Delay Alignment
Select the traces for your subwoofer and full-range speaker, then simply place the cursor at the crossover frequency to instantly calculate the appropriate delay time.
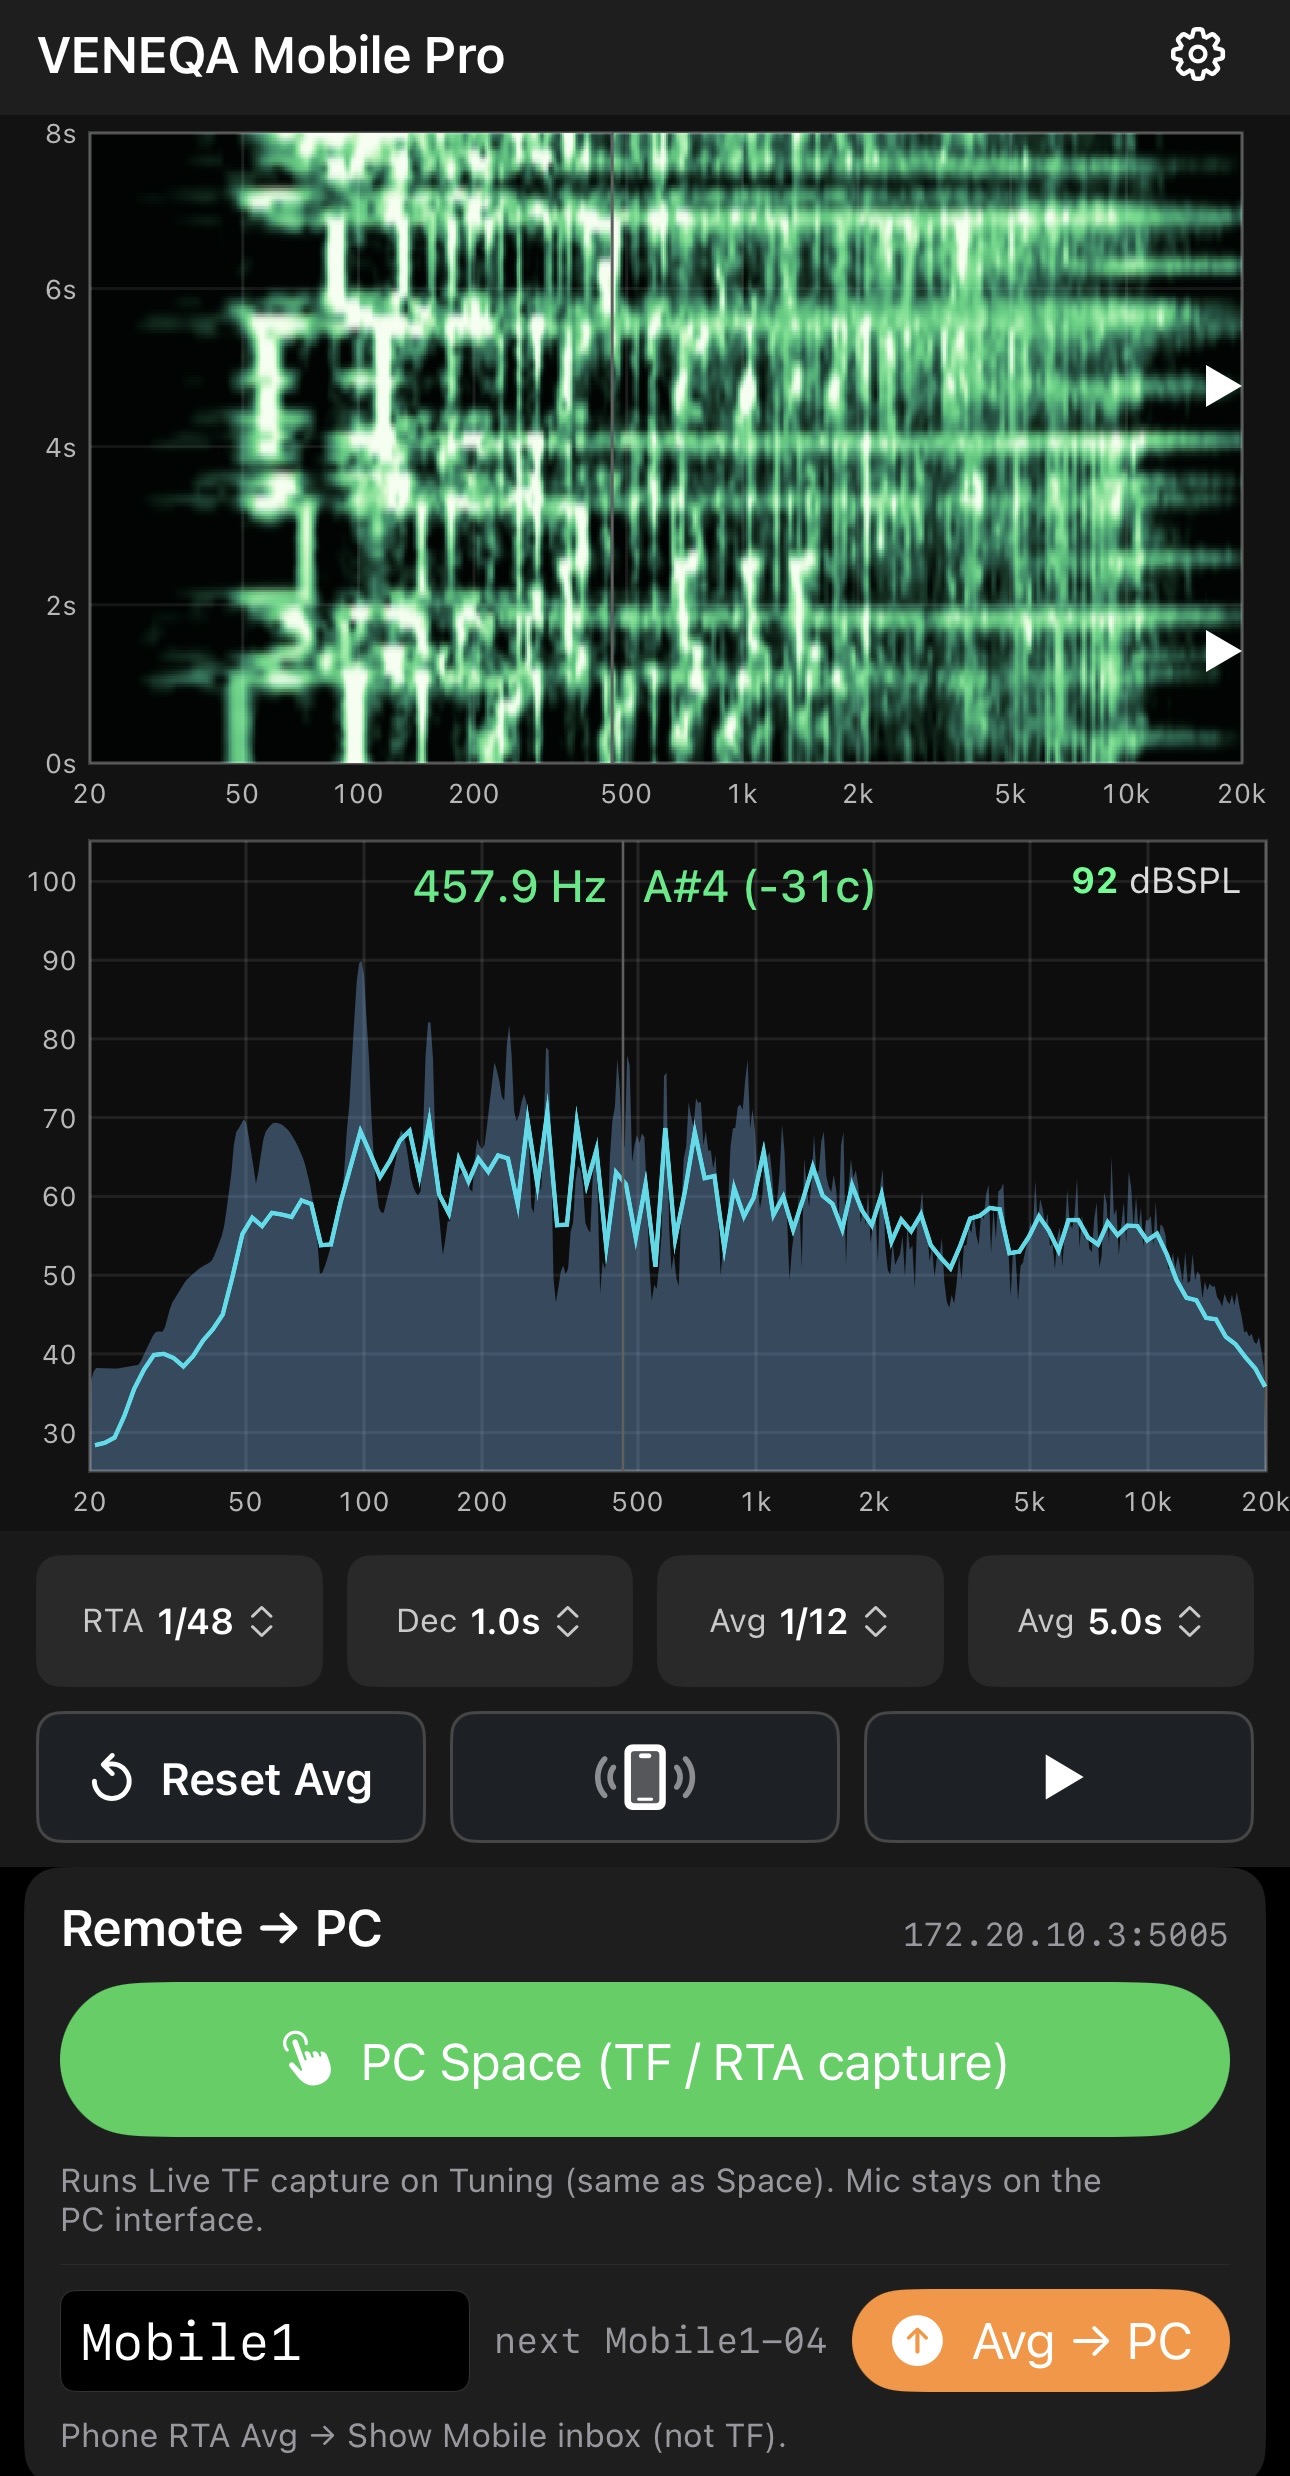
Mobile App
Remotely capture Transfer Function measurements with VENEQA Mobile Pro.
There’s no need to return to your PC every time you move the measurement microphone, allowing you to complete your measurements faster.
Show Mode
See the Big Picture. Hear Every Detail.
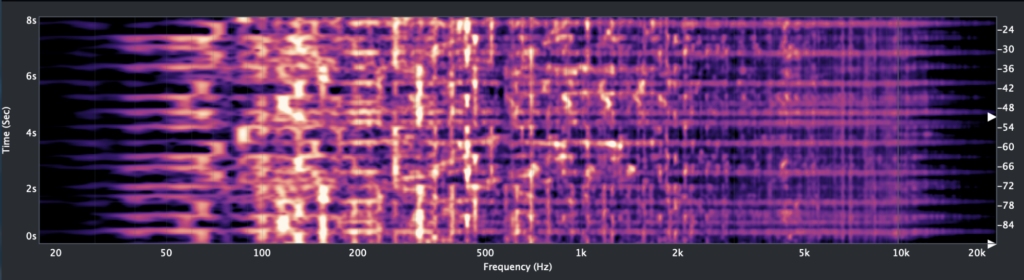
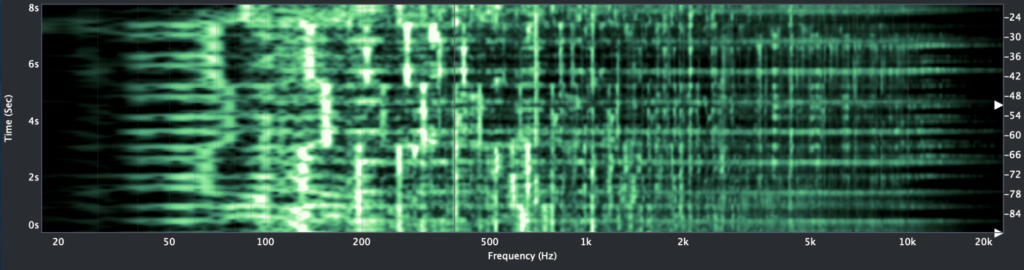
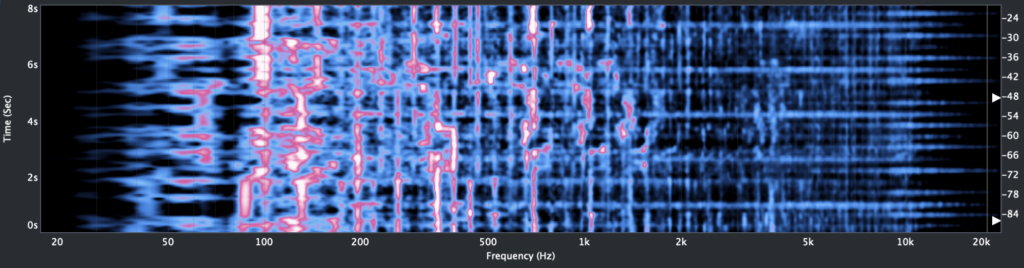
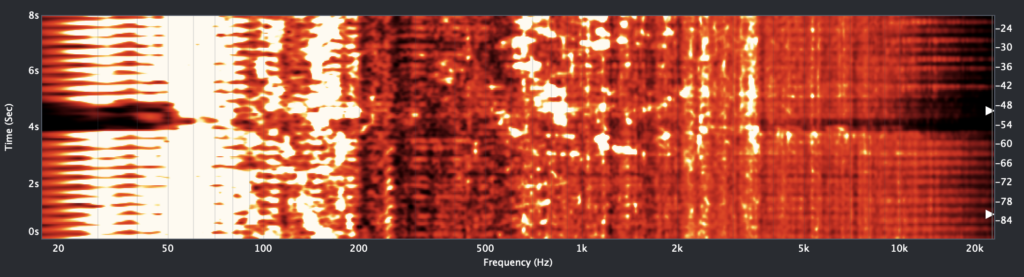
Spectrogram
An exceptionally smooth spectrogram designed for clear and detailed visualization.
Choose from several original color maps to match your workflow—or simply your mood for the day.
RTA
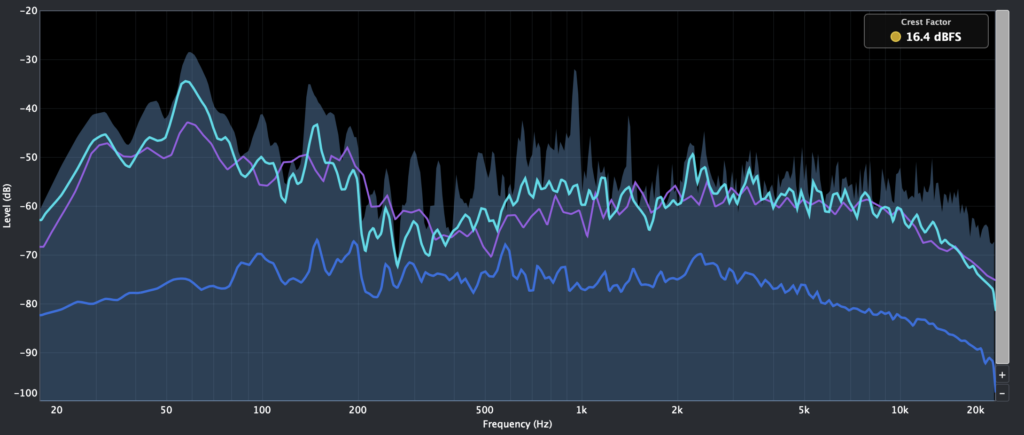
View both instantaneous and time-averaged responses at the same time for a clearer understanding of your sound.
Quickly identify both momentary changes and overall trends in a single view.
SPL Meter
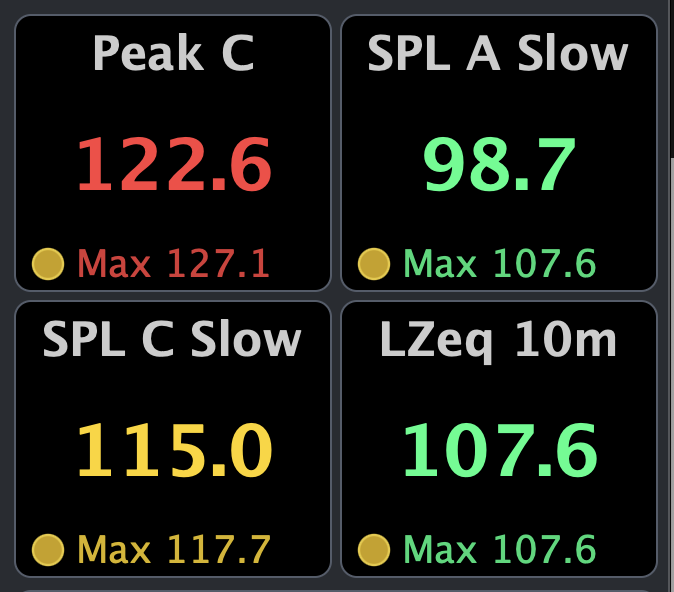
Display SPL measurements based on IEC 61672-1, with A, C, and Z frequency weighting.
2mix Recorder
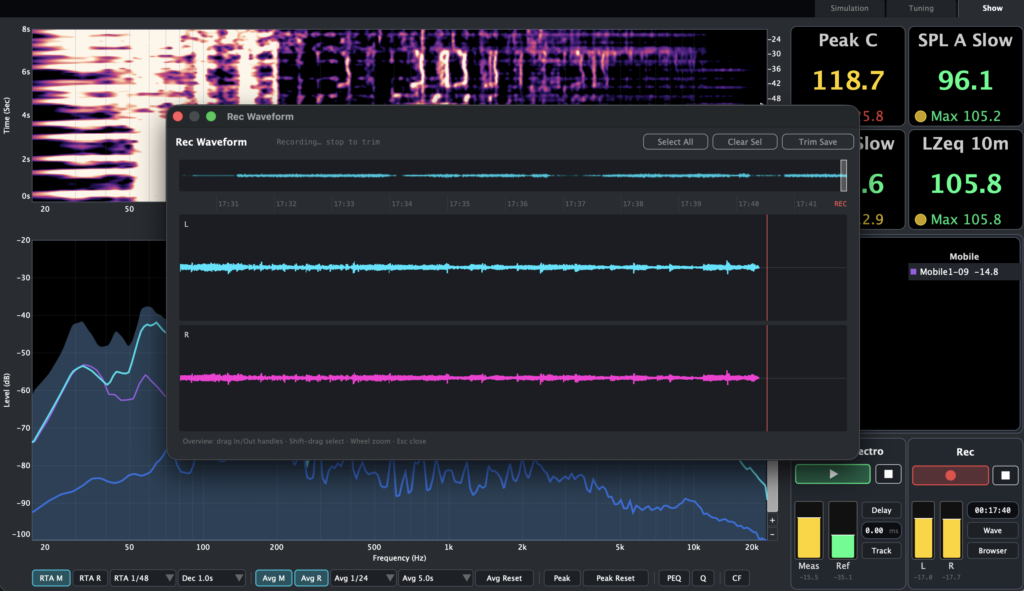
Record your live show while measuring at the same time.
No more carrying a separate portable recorder just for live recording.
Mobile App
Send averaged RTA traces from the VENEQA Mobile App to your PC with a single tap.
Walk through the audience area during a show and capture measurements to better understand the sound across the venue.